ICT sector expanding, skilled workers missing

Firms in New Zealand's information and communications technology (ICT) sector are pouring money into both expansion and research and development, according to a major report.

Attracting highly-skilled graduates remains a persistent problem for the industry though.

The Government today released the Information and Communications Technology Report, which looks at the health of ICT manufacturing, telecommunications, and information technology services.

It shows that a third of all firms undertook research and development last year - four times the average in other sectors - at an average spend of $1.1 million.

Nearly half of companies in the sector invested in expansion, which was almost twice the national average.

Economic Development Minister Steven Joyce said the ICT sector contributed 5 per cent of the country's GDP.

One of the sub-sectors, IT services, had acheved export growth of 10 per cent per annum since 2002, he said.

One of the biggest challenges facing the sector was the international shortage of highly skilled IT professionals, Joyce said.

"Around half of computer system design firms report moderate or severe difficulty in recruiting managers and professionals, and more than half report moderate or severe difficulty in recruiting technicians and associated professionals."

The number of degree graduates with IT specialties is predicted to increase from 1200 in 2011 to between 1600 and 1900 annually by 2014.

"That sort of growth will need to continue in the years ahead," Joyce said.

The ICT report also showed strong job growth and that wages and salaries paid in the sector were twice the New Zealand average.

In the computer system design sub-sector, about extra 1,630 jobs were created last year alone.

Another trend in the industry was increased funding from angel and venture investors.

Firms su! ch as SLI Systems and Optimizer HQ have listed on the local sharemarket this year, and Wynyard Group is set to follow suit later this week.

The government is this year releasing reports on seven sectors - including high-technology manufacturing, construction, petroleum and minerals, tourism, knowledge-intensive services - and today's ICT report is the first.

"These reports by the Ministry of Business, Innovation and Employment provide detailed information about each sector and will be valuable for informing the debate about our economic future," Joyce said.

"They show the change that is occurring in the New Zealand's economy with the emergence of sectors like information technology alongside our traditional export sectors of food and beverage, forestry and tourism."

ICT manufacturing, telecommunications, and information technology services collectively employed 73,392 New Zealanders last year, representing 3.2 per cent of the national workforce.

By Ben Chapman-Smith Email Ben

5 Ridiculous SEO Myths That People Believe

seo myths

The SEO industry is wrought with folklore. Much of what is said doesn’t come with the evidence to back it up. Granted, we’re not immune to truisms of our own, and sometimes it’s not a bad idea to put intuition first. But there’s a difference between truisms or ethical stances and opinions masquerading as facts. I’d like to debunk a few SEO myths today, so let’s get started.

1. Links Are the Most Important Ranking Factor

This is the one SEO myth that gets said so often everybody accepts it as truth. It’s so ubiquitous that I wouldn’t be surprised if we accidentally found ourselves saying it at some point in the past. Links are just so crucial and so hard to earn that we tend to think of them as the most important ranking factor.

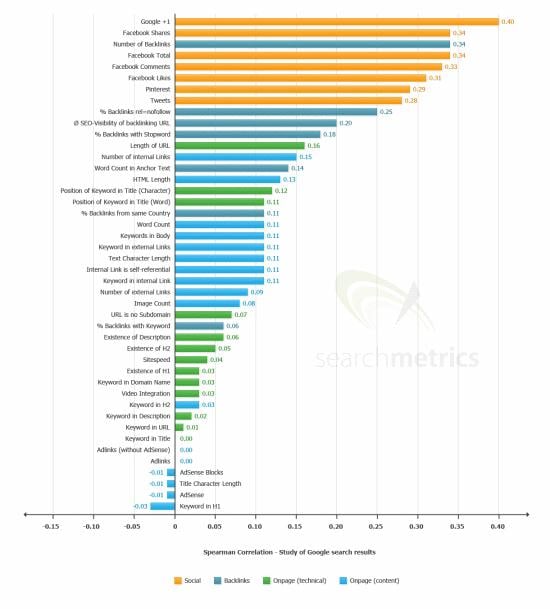
The truth is very different. Relevance is the most important ranking factor. Take a look at the latest compilation of ranking factors from Search Metrics:

Search Metrics

Sure, at first glance, it looks like the number of backlinks is more important than having the keyword in the title. After all, backlinks had a correlation of 34 percent and having the keyword in the title had a correlation of zero percent. They must be useless, right?

Not even close. The correlation was zero, because across thousands of searches, the top 30 search results all had the keyword in the title. There was no correlation because it was a prerequisite to rank in the top 30.

It’s simple. To get traffic, Google needs to fetch your page as a match to the query before you even show up. Having the keyword present in your content, preferably in the title, is by far the most important factor.

The messier truth is that the importance of ranking factors changes depending on the search query, because different ranking factors are prioritized under different circumstances. High quality links are important because they are hard to get, but they are not the most important ranking factor. You need to take a more holistic approach if you want to succeed consistently.

2. Bounce Rate is a Ranking Factor

This SEO myth comes up a lot more often than I would ever expect and it’s completely false. Matt Cutts has flat out said that Google does not use bounce rate as a ranking factor, nor do they use analytics data.

This should be rather surprising, considering that Google can, in fact, easily tell if you have clicked back from a search result and how much time you’ve spent on the site. So maybe they don’t use bounce rate, but instead use time on site before returning? This quote from Matt Cutts suggests that’s also unlikely:

Bounce rate doesn’t measure quick answers you get. You get the answer and leave, so it isn’t a good metric for Google to use.

A more convincing argument is that Google uses “pogosticking” to infer user satisfaction. In other words, if a user clicks on your page, leaves quickly and then clicks on a different page and stays on it for a long time - then that user probably wasn’t very satisfied with what you had to share.

More importantly, Google has a large collection of other user behavior metrics, some of which they are almost certainly using:

Not to mention the growing collection of Google+ and signed in user data. Click-through data is likely used as well.

But not your bounce rate.

3. Domain Age is an Important Ranking Factor

Some people swear by domain age and may even call it a more important ranking factor than links. But, once again Matt Cutts has come right out and said that the impact on search results is very small once you get past a couple months and that links are a much more important ranking factor.

So why is it that some people swear by domain age as such an important ranking factor?

Undoubtedly, older domains are more likely to have accumulated links over time. They have been around long enough for more user data to be taken into consideration and their competitors have had more time to get punished or demoted for guideline violations.

In other words, when domain age seems important, it’s really because stronger ranking factors have been influenced by the domain’s age. Just having an old site isn’t going to benefit you. But having a site that has proven itself consistently for extended periods of time is another thing entirely.

4. You Can’t Compete With High Domain Authority Results

SEOs can often find themselves obsessing over domain authority, especially during competitive analysis. In reality, we don’t even have strong evidence that there is such a thing as domain authority. At the very least, it is loosely defined and defined differently by everybody that uses it. We’ve used this terminology ourselves, but really it’s just a way of generalizing the potential of your internal links.

Let’s start with Moz’s own correlation data. Among site-wide factors, even their own domain authority metric isn’t the best factor to use. It has a correlation of 21%, while the total number of linking root domains with partial match anchor text has a correlation of 25%.

This is actually identical to the correlation for the number of linking root domains with partial match anchor text among page level factors. Again, 25%.

Is there any reason to suspect that what we call domain authority is anything more than the power of internal linking?

In my experience, I haven’t seen any data to suggest that domain authority exists in any meaningful sense. I’m more inclined to believe that internal links are essentially as helpful as external links.

If you come across a competing page on a high domain authority site, all you really need to do is look at the links to that page, whether they’re external or internal. Treat the host domain just like any other.

In other words, if the competing page just has one link from the home page, all you would need to do is get a link from a page with more authority than their home page and you’d have them beat.

I’m simplifying, of course, since there are so many other ranking factors to deal with, but as far as “link juice” goes, I’ve never seen any evidence to suggest you should think about it any other way.

5. The Best Way to Grow Traffic is to Boost Rankings

And finally, we come to a foundational SEO myth that might shake some SEOs right to the core.

We strongly believe that it’s important to improve your ranking potential with inbound links, relevance, purposeful content and many other factors, but rankings are not the only way to increase traffic.

I’ve successfully made the front page or the top spot enough times to realize that my traffic estimates for keywords are inconsistent at best. Google’s keyword tool is a poor guide and the only way to accurately estimate traffic is to buy PPC ads and pay enough to show up every time. Since it takes tremendous resources to improve your rankings for competitive keywords, you can end up pouring a lot of wasted effort into a single ranking.

A less risky way to grow traffic is to continue investing in promotion while producing content for relatively low competition keywords. When promotion fails to improve my rankings, I often find it more useful to just move on and produce more on-site content.

You want to have a system that chooses keywords with relatively high traffic potential with little or no promotion for that individual piece, as well as writers and developers who can put together the best piece of content on the subject. You need to think of this as a process and get some project management in place. It’s a good idea to use a tool like WorkZone or the heftier MS Project to keep your process in check.

Conclusion

Successful SEOs put myths to the test and don’t take advice for granted. I hope this has been enlightening. If you have counter-evidence or other SEO myths to add, I’d love to hear what you have to say.

Myth Photo via Shutterstock


Google Databoard Lets You View Research, Create Infographics

google databoard

Google recently unveiled a new tool that allows you to view a variety of the company’s research, in one place, through a simple to browse dashboard.

It also enables you to easily combine the data of your choice into custom infographics to share with your customers and audience.

Introducing the new Databoard for Research Insights on the official Google Inside Adwords blog, Adam Grunewald, Google’s Mobile Marketing Manager explained:

It’s important for businesses to stay up to date about the most recent research and insights related to their industry. Unfortunately â€" with so many new studies and with data being updated so often â€" it can [be] difficult to keep up. To make life a bit easier, we created the Databoard for Research Insights, which allows people to explore and interact with some of Google’s recent research in a unique and immersive way.

Simply enter Google Databoard and choose the research that most interests you or is most relevant to your business.

What You Can Find in Google Databoard

For example, one collection of studies entitled Mobile Search Moments examines mobile search and how it affects conversions and consumer behavior. Another entitled The New Multi-Screen World looks at how customers engage with smartphones, tablets, laptops and other screen-based communications.

A third section on mobile in-store research looks at specifically how smartphones have transformed retail. A fourth called Our Mobile Planet simply looks at how consumers use the Internet with the arrival of the smartphone.

You can download a study in its entirety in PDF format or select a portion of the study you would like to view. Once within the study you can click on individual “data tiles” containing specific data and graphs providing more detailed information.

Share or Create an Infographic

If you want colleagues, customers or social media followers to have the information too, Google has made the process very simple.

A button at the top of each page lets you “share” the information you are looking at via Google Plus, Facebook, Twitter, or e-mail. You can also copy a URL link and place it in an email or on your website or blog.

Another feature lets you add selected data tiles into a customized infographic which you can then share on social media channels, through email or through a URL link.

The below video gives a simple overview to get you started with using the Databoard for Research Insights for your business, customers, clients and followers.


Merchant bank launches cyber security advisory division

Merchant bank and operational risk business Salamanca Group has added a cyber security division to help its clients combat the threat of attacks on computer networks.

Created in a joint venture with Si-SecureView, it said that since 2005, the team has been involved in a number of high profile projects providing IT security architecture, stress-testing systems and a variety of other solutions for government agencies and private sector companies.

The new division will manage clients' network infrastructure to ensure cyber security and risk compliance. This will include 24-hour monitoring and management of firewalls, servers and switches, according to the company.

This can be done either as a cloud-based service remotely through Salamanca Group's security operations centres (SOCs) or for those who want a localised approach, people, process and technology can be located to client sites.

Also offered are business continuity planning, response teams, professional services for vulnerability assessments, penetration testing, firewall migration and web application security testing.

Feras Tappuni, managing director of Si, said: “The launch of Salamanca Group's cyber security division represents a significant step forward in ensuring the adequate protection of security systems and we feel confident that with the expertise of our team, we are providing a service that will become an essential security factor for all businesses in the future.”

Heyrick Bond Gunning, managing director of risk management at Salamanca Group, said: “Cyber security is a growing and ever complex threat for both large and small companies, with the potential to cost them hundreds of thousands of pounds and irreparable reputational embarrassment.

“As we have seen from recent high profile attacks, it is vital that businesses are able to protect themselves from potential threats and in the case of penetration, are able to swiftly respond and remediate threats before they impact the security and reputation of a business.”


Increase in bug bounty payments predicted to boost patch releases

The quantity of patches released by Microsoft will rise this year and into the future after its decision to increase bug bounty payments.

Speaking to SC Magazine, Mark Raeburn, CEO of Context Information Security, said: “The increase in bug bounties will increase the number of patches as more people will be looking out for flaws and they will be looking to fix them.

“Microsoft is late in the day on this, but it is good. You can pay people to do it or allow anyone to do it and pay them afterwards, provided it is done in a managed environment.

Microsoft announced that it will pay up to $100,000 (£64,670) for 'truly novel exploitation techniques' against protections built into Windows 8.1 Preview, while it will pay up to $50,000 (£32,335) for defensive ideas that accompany a qualifying mitigation bypass submission.

Finally, it will pay up to $11,000 (£7,113) for critical vulnerabilities that affect Internet Explorer 11 Preview on the latest version of Windows, although these must be submitted in the first 30 days of the Internet Explorer 11 beta period (between 26th June and 26th July 2013).

Craig Young, security researcher at Tripwire, said: “I think that the changes to the bounty program not only help researchers feel that their efforts are appreciated by Microsoft, but that it could over time actually reduce the number of patches as Microsoft's exploit mitigation techniques improve through increased scrutiny from white hat researchers.”

Paul Henry, security and forensic analyst at Lumension, said: “Since the announcement of the program took most security researchers by surprise, it will likely be a few months before we really see the effects of the program. That said, I do expect to see the number of bulletins Microsoft issues increase over the second half of this year.

“Microsoft has long resisted implementing a bug bounty program, which other vendors have found success with. The start of the program will likely increase the number of bulletins we see over time, but in the long run, will ensure that Microsoft products are more secure. It will also help motivate researchers to improve their disclosure with Microsoft over other sources that purchase vulnerabilities, which includes bad guys.

“This ensures Microsoft will be aware of vulnerabilities more quickly and we won't see as many bugs being exploited in the wild before Microsoft is ready to release a patch.”

Tyler Reguly, technical manager of security research and development at Tripwire, said: “I think that the platforms covered by the bounty program will limit the number of submissions. We may see additional patches, but I don't suspect we'll see vastly increased numbers.

“In the end though, while patches make the lives of those in IT more difficult, they improve security and make everyone safer.”


Angel Investments Since the Economic Downturn

angel investments

In an earlier post, I discussed how venture capital deals have changed since the financial crisis and the Great Recession. Today, I want to point out some changes in angel deals and angel investments over the same period.

Because there is a lot less information on angel investing than on venture capital, I will concentrate on just four dimensions of angel finance:

  • The number of investors.
  • The amount invested annually.
  • The number of businesses funded each year.
  • The average size of the investments.

Number of Angel Investors

The number of angel investors isn’t appreciably different now from what it was before the Great Recession. The Center for Venture Research (CVR) at the University of New Hampshire estimates that there were 258,200 angel investors in the United States (PDF) in 2007 and 268,160 in 2012.

That’s a change of less than 4 percent.

Amount Angel Investments

The amount of financing provided by business angels has changed by much more, declining 20 percent inflation-adjusted terms from before the recession to last year. According to CVR’s estimates, angels invested $27.3 billion in 2007 versus $21.8 billion in 2012 (both measured in 2010 dollars).

Number of Companies Financed

In contrast to the amount of money provided to entrepreneurs, which is now lower than before the start of the Great Recession, the number of companies receiving financing is currently substantially higher. The CVR estimates a 17.3 percent increase in the number of companies funded by angels between 2007 and 2012 (from 57,120 to 67,030).

Angel Investment Size

The decline in the amount of capital provided by angel investors combined with the increase in the number of companies that business angels have financed has led a sizable drop in the size of average angel investments.

As the figure below shows, average angel investments were roughly one third lower last year than in 2007, when measured in real terms. Moreover, the relatively constant size of the average angel investment in the early part of the 2000s and again since 2008 suggests that the financial crisis and Great Recession has led angels to fundamentally alter the size of their investments.

Source: Created from data from the Center for Venture Research at the University of New Hampshire

In short, angels have responded to the changed economic environment, not by exiting the market, but by providing less money to more startups, thereby dramatically reducing the size of the average angel investment.

Business Angel Photo via Shutterstock